Concepts
pond-ts is an in-memory TypeScript time series library covering both batch and streaming use cases as peers — same schema type, same operator surface, different cost models. Not a database, not a query engine, not a full streaming system.
Mental model
A series is a schema-typed, ordered collection of events. Events carry a temporal key plus a typed payload. Operators transform series into series; reducers compress events into values.
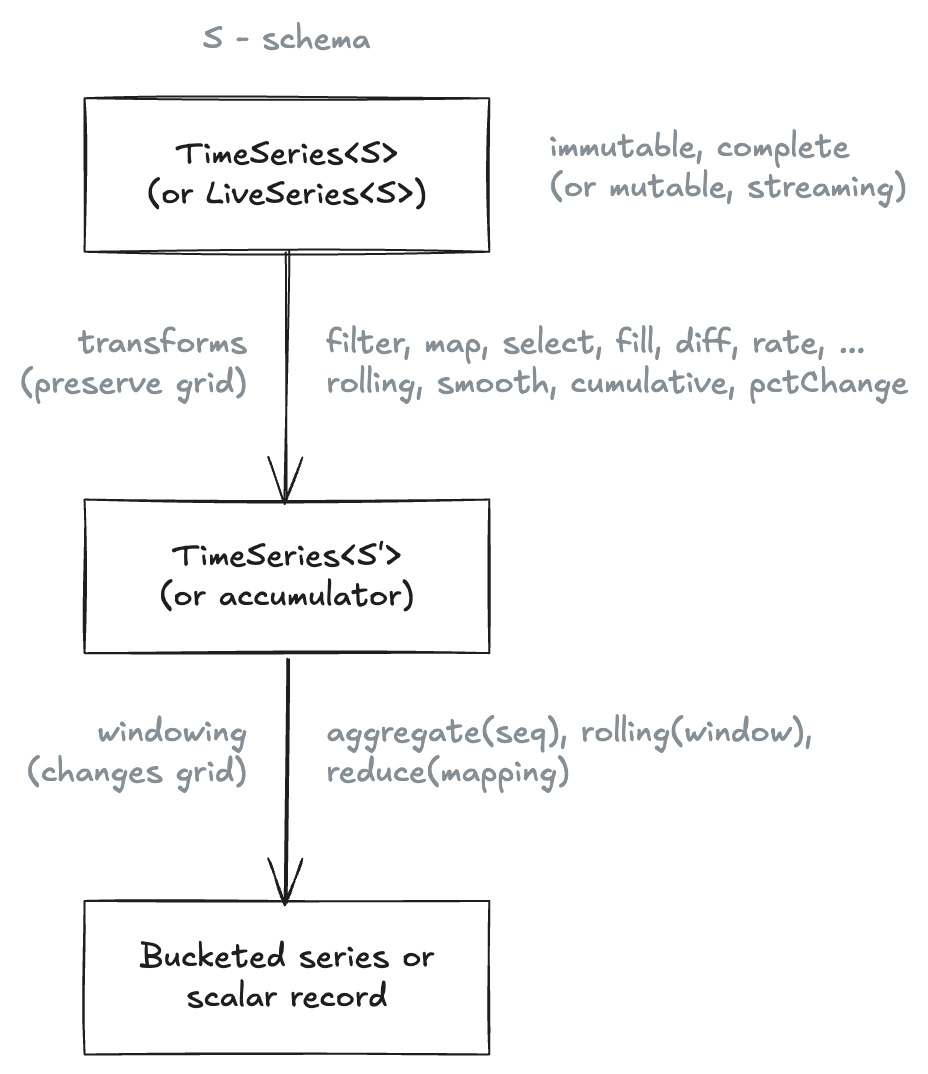
The schema S carries through every transform — the type system
narrows column shapes correctly without as casts.
Core primitives
| Primitive | What it is | Page |
|---|---|---|
| Temporal keys | Time / TimeRange / Interval — points and spans on the timeline | Temporal keys |
| Sequences | Grid definitions (fixed-step / calendar / bounded) | Sequences |
| Series | TimeSeries (batch) and LiveSeries (streaming) — peers | Series |
| Temporal relations | within / overlapping / trim; tail, first, last as concepts | Temporal relations |
| Windowing | Full / fixed / rolling / streaming-rolling / multi-window — five modes | Windowing |
| Triggers | When live aggregations emit (event / every / count) | Triggers |
| Partitioning | Per-entity scope: split, operate, fan in | Partitioning |
| Late data | "Data is the clock"; ordering modes; grace windows | Late data |
Read the pages reference-style — definitional, no walkthroughs. The operator pages assume the vocabulary these introduce.
Coming from pandas?
pandas's .resample() covers both directions; pond-ts splits them:
- Downsample (fewer rows out than in) —
aggregate(seq, mapping)≈.resample().agg() - Upsample / regrid (one row per grid point, hold or interpolate) —
align(seq, { method })≈.asfreq()+.ffill()/.interpolate('time') rolling(window, mapping)≈.rolling().agg()within(range)/overlapping(range)/trim(range)≈.loc[]slicing with three explicit semanticsreduce(mapping)≈.agg()on the whole framegroupBy(col)≈.groupby(col)
See Aggregation for the deep dive on bucketing.
Coming from pondjs?
| pondjs | pond-ts |
|---|---|
TimeSeries (sorted) | TimeSeries (1:1 conceptually; methods differ) |
Collection (unordered) | TimeSeries — pond-ts only exposes the sorted variant |
IndexedEvent | Event<Interval> |
TimeRangeEvent | Event<TimeRange> |
Pipeline + processors | method chain on TimeSeries |
Pond / Aggregator | batch aggregate() or LiveAggregation |
Pond-ts deliberately drops the Collection / TimeSeries
distinction. A bucket is a smaller TimeSeries, so anything that
works on a series works on a bucket — same API, no second primitive
to learn.
What pond-ts isn't
- Not a database. No persistence layer. Snapshots round-trip through JSON; the storage is your problem.
- Not a query engine. No SQL surface. Operators are the query surface, end-to-end typed.
- Not a full streaming engine.
LiveSeriesis a bounded in-process buffer with bounded reorder tolerance. No watermarks, no exactly-once, no retraction. See Late data for the trade-offs. - Not a chart library.
series.toPoints()is the bridge; pick any chart library that consumes[x, y]tuples.