Aggregation
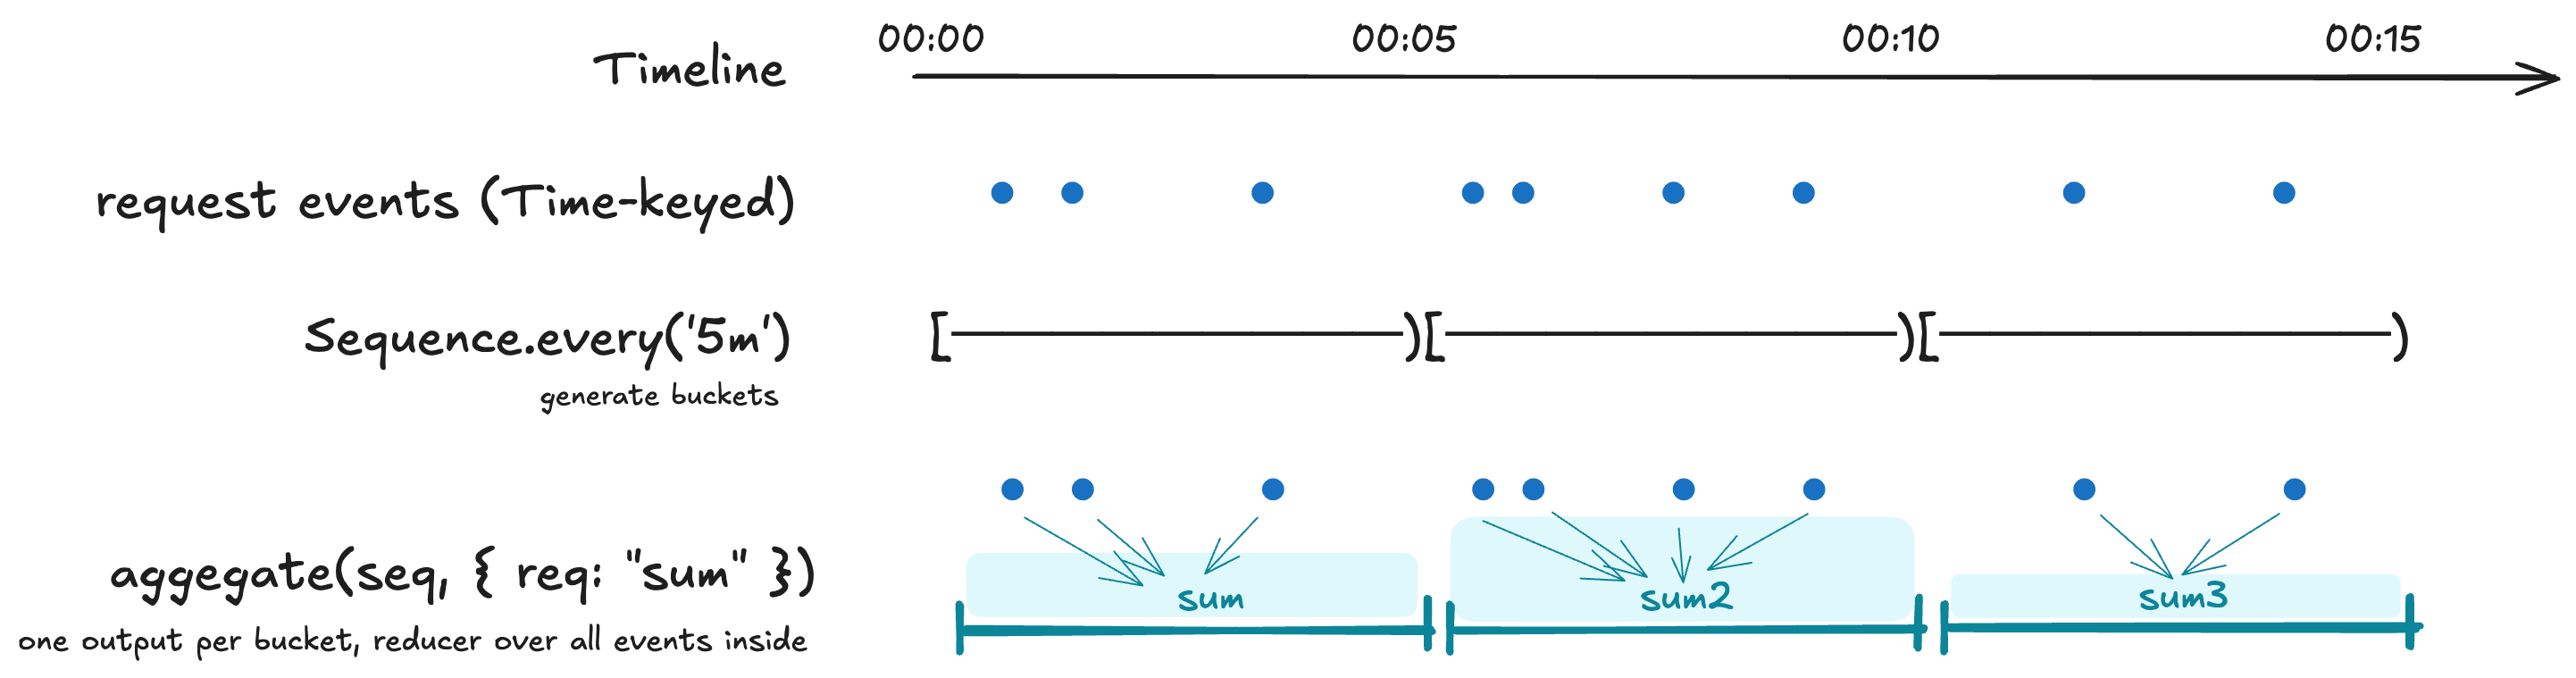
aggregate(seq, mapping) collapses events onto a
Sequence grid — one
Interval-keyed output row per bucket, computed by reducing every
source event whose key falls inside the bucket.
This is the right operator when the question is "what's the rollup of every event in this bucket?" — per-minute averages, hourly counts, daily peaks. For "what was the value at this grid point?", reach for Alignment instead.
This page covers four shapes of "collapse many events into fewer":
aggregate(seq, mapping)— one row per bucket on a sequence grid (the time axis).reduce(mapping)— collapse a whole series into a single record. "Bucket size: all of it."byColumn(col, binning, mapping)— one row per value-bin of a numeric column (a value axis, not time).arrayAggregate(col, reducer)— reduce one array cell per event.
Plus the live-side counterpart: LiveAggregation (incremental
bucketed aggregation over a LiveSeries).
For partition-by-column (groupBy) and long-to-wide reshape
(pivotByGroup), see Reshaping — those are
shape-changing ops, not value collapses.
- pondjs
Aggregator→aggregate()for batch,LiveAggregationfor streaming. Pipeline+Processor→ method chain onTimeSeries; a custom reducer function fills theProcessorrole.Index-keyed buckets →Interval-keyed events. The full rename table is on Concepts.
aggregate
import { Sequence, TimeSeries } from 'pond-ts';

const fiveMin = cpu.aggregate(Sequence.every('5m'), {
  cpu: 'avg',
  requests: 'sum',
  host: 'last',
});
// fiveMin.schema[0].kind === 'interval'
// fiveMin.at(0)?.get('cpu') -> number | undefined
The output is interval-keyed. To feed it into a transform that
requires a time-keyed series (e.g. pivotByGroup, which throws at
runtime on interval keys), rekey first with .asTime({ at: 'begin' }).
Mapping shapes
Two forms; mix them in one call:
cpu.aggregate(Sequence.every('5s'), {
  // shorthand: "avg of cpu, output column same name"
  cpu: 'avg',

  // explicit { from, using, kind? } — rename the output column
  cpu_p95: { from: 'cpu', using: 'p95' },

  // multiple reducers over the same source column
  requests_total: { from: 'requests', using: 'sum' },
  requests_peak: { from: 'requests', using: 'max' },
});
Use the explicit form when you want to rename, run multiple reducers over one source column, or use a custom reducer whose output kind differs from the source.
Mixing the two forms keeps every output column in the result type,
each narrowed per its reducer — cpu and requests_total come back
as number | undefined, a { from: 'host', using: 'first' } spec as
string | undefined, and so on. (Before v0.23.0 a mixed mapping
silently dropped the { from, using }-keyed columns from the result
type — they were still emitted at runtime, but event.get('cpu_p95')
wouldn't type-check. The single unified mapping shape fixes this.)
Shorthand entries stay validated at compile time: a reducer that
doesn't fit the source column's kind (host: 'avg' on a string
column) or a bare reducer on a column that doesn't exist
(ghost: 'avg' — a typo) is a type error. Spec keys are free output
names — only their from must name a real column.
Custom reducers
Reducers are
(values: ReadonlyArray<ColumnValue | undefined>) => ColumnValue | undefined.
Filter the undefineds yourself if needed; the input is the raw bucket.
Two shapes:
// Same column in, same column out — shorthand key.
cpu.aggregate(Sequence.every('5s'), {
  cpu: (values) => {
    const nums = values.filter((v): v is number => typeof v === 'number');
    if (nums.length === 0) return undefined;
    const sorted = [...nums].sort((a, b) => a - b);
    return sorted[Math.floor(sorted.length * 0.999)];
  },
});

// Renamed output — wrap the function in the explicit spec.
cpu.aggregate(Sequence.every('5s'), {
  cpu_p99_9: {
    from: 'cpu',
    using: (values) => {
      const nums = values.filter((v): v is number => typeof v === 'number');
      if (nums.length === 0) return undefined;
      const sorted = [...nums].sort((a, b) => a - b);
      return sorted[Math.floor(sorted.length * 0.999)];
    },
    kind: 'number',
  },
});
Bucket membership
Buckets are half-open: [begin, end). An event at exactly the
boundary lands in the later bucket. For TimeRange- or
Interval-keyed source events, the event contributes to every bucket
it overlaps under half-open overlap rules.
range
Default range is the source's own time extent. Pass options.range
to pin the output range explicitly — useful when you want a uniform
grid over a specific window even if the source doesn't fill it:
cpu.aggregate(
  Sequence.every('5s'),
  { cpu: 'avg' },
  { range: new TimeRange({ start: 0, end: 60_000 }) },
);
Empty buckets in the padded range emit 0 for count and sum,
undefined for everything else. See
Reducer reference → Empty-bucket behavior.
reduce
Whole-series → scalar or record. Same reducer vocabulary as
aggregate, same empty-bucket behavior.
// Single-column form — wide return type.
const avgRaw = series.reduce('cpu', 'avg'); // ColumnValue | undefined
The single-column form returns the wide ColumnValue | undefined —
the type system can't see through a string reducer name. Use the
mapping form whenever you want narrowed types at the call site.
Mapping form returns a record with per-field narrowing:
const summary = series.reduce({
  cpu: 'avg', // number | undefined
  requests: 'sum', // number | undefined
  host: 'unique', // ReadonlyArray<string> | undefined
});
Named outputs work too:
const quantiles = series.reduce({
  p50: { from: 'latency', using: 'p50' },
  p95: { from: 'latency', using: 'p95' },
  p99: { from: 'latency', using: 'p99' },
});
See Reducer reference → Type narrowing on reduce for the full narrowing story.
byColumn
aggregate buckets the temporal key; byColumn buckets a numeric
value column. Same reducer mapping, but each output row is one
value-bin — per-kilometre splits over cumulative distance, a power
histogram, time-in-zone over heart-rate edges.
// Per-kilometre elevation gain and average speed over a ride.
const splits = ride.byColumn(
  'cumDist',
  { width: 1000 },
  {
    gain: { from: 'ele', using: 'sum' },
    speed: { from: 'speed', using: 'avg' },
  },
);
// → [{ start: 0, end: 1000, gain: 12.4, speed: 7.1 },
//    { start: 1000, end: 2000, gain: 8.0, speed: 6.4 }, ...]
The result is a plain array of bin records, each
{ start, end, ...aggregates } — not a TimeSeries. Value-bins
(distance, power) aren't time-indexed, so there's no key to build one
from; this mirrors reduce's plain-record return. Reach for byColumn
whenever the x-axis of your rollup is a value rather than time.
Even bins — { width, origin? }
Fixed-width bins (shifted by origin, default 0), emitted
contiguously from the lowest to the highest occupied bin — interior
empty bins included, so a histogram or profile has no gaps:
// Power distribution: seconds spent in each 25 W band.
ride.byColumn('watts', { width: 25 }, {
  secs: { from: 'watts', using: 'count' },
});
// → [{ start: 0, end: 25, secs: 3 }, { start: 25, end: 50, secs: 0 }, ...]
A monotonic source (cumulative distance, work) yields contiguous ranges — splits, an elevation-vs-distance profile. A non-monotonic source (instantaneous power) yields a histogram. Same call, both shapes.
Explicit bins — { edges }
Ascending edges [e₀, …, eₙ] give n bins, bin i = [eᵢ, eᵢ₊₁) —
one record per bin, in order. Use them for named zones:
// Time in each power zone (FTP-relative edges).
ride.byColumn('watts', { edges: [0, 150, 250, 350, 500] }, {
  secs: { from: 'watts', using: 'count' },
});
// → one record per [0,150), [150,250), [250,350), [350,500)
A value below the first edge or at/above the last is out of range, and that row is dropped.
Edge cases
- A row whose bin value is missing or non-finite contributes to no bin. Within a bin, the reducer non-finite policy still applies to the source columns.
- Empty bins emit each reducer's empty value (
count→0,avg/min/ … →undefined) — exactly like an emptyaggregatebucket. startandendare reserved output names (they carry the bin range), and a non-finite or wrong-kind reducer result throws — the same write-time guardaggregateenforces.
arrayAggregate
Reduce one array cell per event — feeds each event's array to a reducer as if it were a bucket. Per-event in / per-event out.
// "Number of tags per event" — replace the array column with a count.
events.arrayAggregate('tags', 'count');

// Same, but keep the original array column too — append a new
// `tagCount` number column alongside.
events.arrayAggregate('tags', 'count', { as: 'tagCount' });

// Distinct values per event, deduped (keeps the array column).
events.arrayAggregate('tags', 'unique');
Full treatment, including custom reducers and the flatten-one-level semantics on array-kind sources, lives on Array columns.
LiveAggregation
The live counterpart to aggregate. Buckets close incrementally as
the watermark advances:
import { LiveSeries, Sequence } from 'pond-ts';

const live = new LiveSeries({
  name: 'cpu',
  schema,
  retention: { maxAge: '1h' },
});

const agg = live.aggregate(Sequence.every('1m'), {
  cpu: 'avg',
  host: 'last',
});

// Closed buckets stream out.
agg.on('close', (event) => storeMetric(event));

// Provisional in-progress bucket on every contributing push.
agg.on('bucket', (event) => updateLiveTile(event));

// Snapshot at any time — includes the open bucket as the last row.
const snap = agg.snapshot();
LiveAggregation inherits the source's graceWindow for late-event
tolerance at bucket closure. See Live transforms →
Late-event scope for what
that does and doesn't propagate further down the pipeline.
Method comparison
| Method | Returns |
|---|---|
aggregate(seq, mapping) | TimeSeries<S> — one row per bucket |
reduce(col, reducer) | Wide ColumnValue | undefined |
reduce(mapping) | Record<key, narrowed> |
byColumn(col, binning, m) | Array<{ start, end, ...aggregates }> — one per value-bin |
arrayAggregate(col, reducer) | TimeSeries<S> — one cell reduced per event |
LiveAggregation(src, seq, m) | Stream of closed buckets + provisional bucket events |
For groupBy and pivotByGroup see Reshaping — those
are partition / long-to-wide ops, not collapses.
Compared to align
Same parameter shape (sequence + range), same output key shape
(Interval-keyed grid), different reduction.
| Question | Operator |
|---|---|
| "What's the rollup of every event in this bucket?" | aggregate(seq, mapping) |
| "What was the value at this grid point?" | align(seq, { method, sample }) |
// aggregate — one row per minute, value reduced from sources inside.
cpu.aggregate(Sequence.every('1m'), { cpu: 'avg' });

// align — one row per minute, value sampled from the source.
cpu.align(Sequence.every('1m'), { method: 'hold' });
For "average CPU per minute," aggregate is right. For a chart at
one-minute resolution where every grid point should have a value,
align is right. The two are complementary.
See Alignment for the sampling counterpart.